Table of Contents
- Temperature & Humidity Sensor at Home
- 1. Introduction
- 2. Methodology
- 3. Discussion
- 4. Acknowledgement
Table of contents generated with markdown-toc
Temperature & Humidity Sensor at Home
- Siwen Li, Xinyao Shen, Zhixing Wang, Jeremy Yin
- video link
1. Introduction
1.1 Motivation
The winters in Pittsburgh are quite dry and humidifiers are commonly used to keep people comfortable indoors. According to the American Society of Heating, Refrigerating, and Air Conditioning Engineers (ASHRAE) Standard 55 - 2004 “Thermal Environmental Conditions for Human Occupancy, the thermal comfort zone for people is related to many factors. Among these factors, relative humidity and temperature are of the utmost concern. Most humidifiers are unable to determine humidity as a function of temperature. Based on these reasons, we want to use the DHT-11 sensor to provide a more user-friendly humidifier by taking temperature into account.
1.2 Goals
- In order to enhance humidifier capability, our project will relate the humidity as a function of temperature and adjust the humidity to the comfortable zone by controlling the on and off of humidifier according to ASHRAE Standard 55 – 2004.
2. Methodology
2.1 Phenomena of Interest
Relative humidity-humidity ratio (specific humidity);
PMV thermal comfort Method and ASHRAE Standard 55-2020 comfortable range;
Psychrometric chart with dry-bulb temperature based on humidity ratio (temperature vs. relative humidity)
Furthermore, Center for the Built Environment Thermal Comfort Tool will be applied in our project.[1]
The model of the humidifier used in this project is listed in section 2.8.
Get the real time humidity and temperature from adafruit.
2.2 Sensors Used
- DHT11
Humidity measurement range: 20 - 90%RH
Humidity measurement accuracy: ±5%RH
Temperature measurement range: 0 - 50℃
Temperature measurement accuracy: ±2℃
Power supply: DC 3.5~5.5V; PCB size: 2.0 x 2.0 cm
Communicates a 40-bit data transfer from the DATA channel containing: [11]
8-bit humidity integer data

8-bit humidity decimal data

8-bit temperature integer data

8-bit temperature decimal data

8-bit parity check data
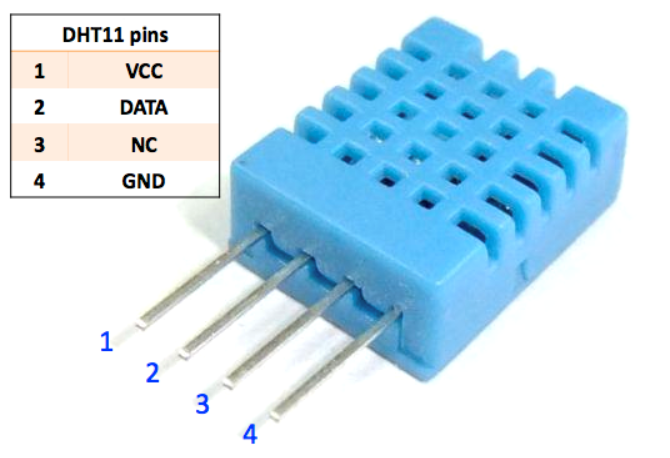
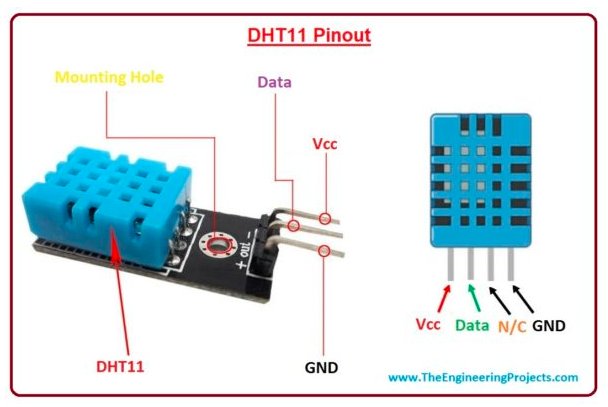
DHT11 pin-out consists of 4 pins, including Vcc, Data, N/C, and Ground. The Vcc pin-out provides 3.3V to 5V power through this pin. The data pin-out transfers a digital output. The N/C pin-out is not connected. The ground pin-out is connected to the 0V and GND. To have a better understanding of the sensor’s pin layout, we have shown a picture of the DHT11 pin-out below: [8]
In order to discuss the working principle of DHT11, we must understand that there are two sensors inside it. Let’s have a look at both of them separately: [8]
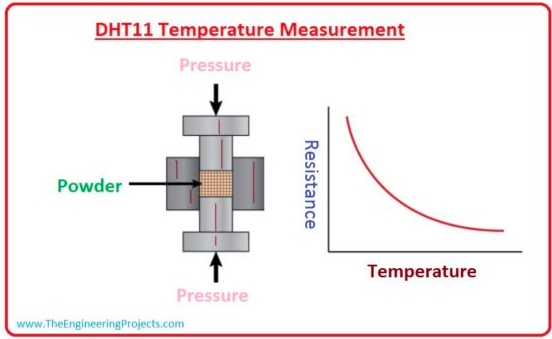
1) DHT11 Temperature Sensing
To sense the temperature in the surrounding environment, DHT11 has an NTC (Negative Temperature Coefficient) temperature sensor, also called a thermistor, mounted on the surface inside the plastic casing. NTC temperature sensors are variable resistive sensors and their resistance decreases with an increase in the surrounding temperature. Thermistors are created by sintering semi-conductive materials, such as ceramic or polymers, as they provide a large change in resistance with a small temperature change. Here’s the graph showing the relation between temperature and resistance for the DHT11 sensor: [8]
2) DHT11 Humidity Sensing
The DHT-11 contains a capacitive humidity sensor that has two electrodes and a porous substrate material in between. As moisture content changes in the environment, the substrate material becomes saturated, which changes the capacitance between electrodes. This change in electrode capacitance is then adjusted using the humidity coefficient, saved in the One-Time-Programmable memory (OTP memory), and the final relative humidity value is returned. Here’s the image showing the internal structure of the DHT-11 humidity sensor: [8]

For the next section, we will talk about how DHT11 communicates with the microcontroller. The circuit diagram to interface DHT11 with microcontroller is shown in the below figure: [8]
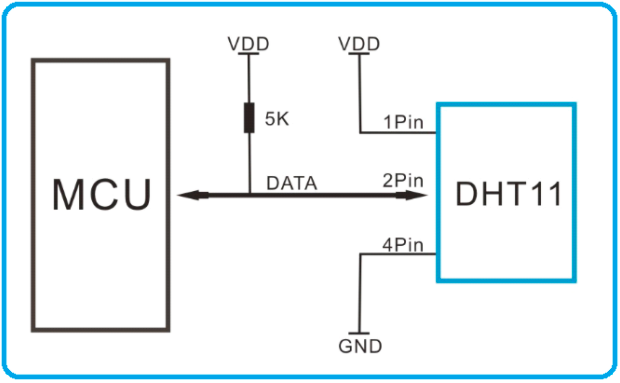
A resistance of 5k ohm for the pull-up resistor should be on the Data pin of the DHT11 sensor. Under normal conditions, the data pin of DHT11 remains at the HIGH voltage level, and the sensor remains in low power consumption mode. To receive data from the DHT11 sensor, the microcontroller should set the Data Pin to LOW for at least 18 µs, so that the sensor can sense it. Once the DHT11 sensor senses the low signal at the Data Pin, it changes its state from low power consumption mode to running mode and waits for the Data Pin to get HIGH. As the Data Pin gets HIGH again by the microcontroller, DHT11 sends out the 40-Bit calibrated output value serially. After sending the data, DHT11 goes back to low power consumption mode and waits for the next command from the microcontroller. The microcontroller has to wait for 20-40 µs between responses from the DHT11 sensor. [8]
2.3 Relative Humidity-Humidity Ratio
Relative humidity is a way of describing how much water vapor is present in the air, compared to the amount needed for saturation at that temperature. On summer nights, dew begins to appear on grass leaves, which indicates that the air is saturated with water vapor and can no longer dissolve it. But if the temperature rises and the dew disappears, that means the water vapor evaporates and dissolves into the air, which is once again not fully saturated. So the absolute water content in the air is constant, but the relative humidity is different.
Humidity contains several aspects including Absolute humidity, Relative humidity, Specific humidity (humidity ratio). Absolute humidity can be defined as the mass of H_2 O in a certain amount of volume, which will be affected by both air pressure and temperature if the volume is not held constant. AH is the absolute humidity, $AH=\frac {m_{H_{2O}}}{V_{net}}$,unit is g/$m^3$
Relative humidity, Rh or ϕ is the ratio of partial pressure of water vapor in the mixture to the equilibrium vapor pressure of water over a flat surface of pure water at a given temperature. [2] $ϕ=\frac {p_(H_{2O})}{p*(H_{2O})}$ (Partial pressure means the percentage of water pressure divided by total pressure.) Once the ϕ increase, air should become wetter. If the ϕ reaches 100%, it will reach the dew point (precipitation). Relative humidity will be affected by temperature. The colder air will get a lower capacity to maintain vapors.
Specific humidity, the humidity ratio, is the ratio of the mass of water vapor to the total mass of the air parcel.[2] Approximate formula should be $\frac {m_{H_{2O}}}{m_{air}-m_{H_{2O}}(dry air)}$ , with unit kg/kg or g/kg. In our project, we also need to consider the transform formula for Specific Humidity and Relative humidity. It should be
$RH=100*\frac {ω}{ω_s} =0.263pq(exp\frac {17.67(T-T_0)}{T-29.65})^{-1}$,
$ω_s=\frac {m_{vs}}{m_d} =\frac {0.622e_s}{p}(approximation)$, es means saturation vapor pressure(pa), it can be get from vapor pressure of water table.[3]
ω means humidity ratio at certain cases,and ω_s means saturation equilibrium humidiy ratio.
q means specific humidity same as ω(approximation),p certain case pressure(can be measured.)
2.4 Thermal Comfort Method (PMV)
The Predicted Mean Vote (PMV) model stands among the most recognized thermal comfort models. [4]
Today, thermal comfort is defined as “that condition of mind that expresses satisfaction with the thermal environment” in the globally recognized ASHRAE 55 and ISO 7730 standards for evaluating indoor environments. [5]
Our group will use PMV method to estimate the thermal comfort with ASHRAE standard and project comfortable range into Psychrometric chart.
2.5 ASHRAE Standard 55-2020
The American Society of Heating, Refrigerating, and Air Conditioning Engineers (ASHRAE) is in charge of the air conditioning, heating, and ventilation design. The ASHRAE Standard 55-2020 specifies acceptable thermal environments conditions and is intended for use in the design, operation, and commissioning of buildings and other occupied spaces. [6]
The table here can be used to estimate an exact value. We use a specific range specified on a web tool from Berkeley.
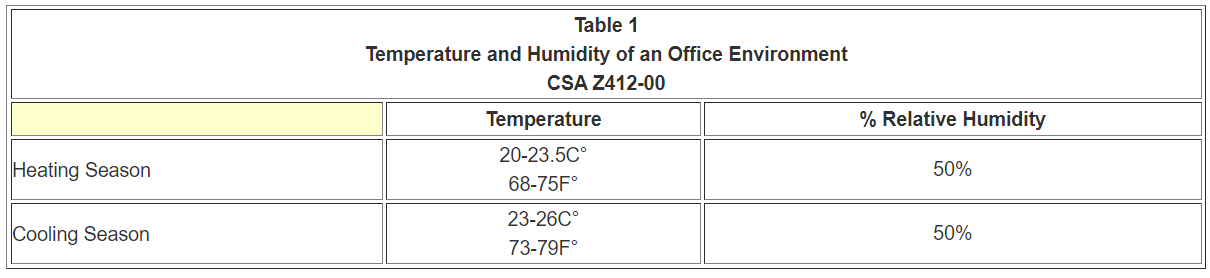
Table 1 presents the values from the Canadian Standards Association (CSA) International’s Standard CAN/CSA Z412-00 - “Office Ergonomics” which gives temperature and relative humidity requirements for offices in Canada. These values are based on the ASHRAE Standard 55 - 2004 “Thermal Environmental Conditions for Human Occupancy”. (The values below are designed to meet the needs of 80% of occupants which means 20% of the occupants will still feel some form of discomfort even if these values are met. Additional measures may be required to ensure comfort for everyone. ASHRAE Standard 55 recommends a range of temperature and humidity values for thermal comfort in office work.)
The reason we use ASHRAE Standard 55 in 2020 is that there is a good web tool that can manipulate inputs and outputs. (Temperature, relative humidity, humidity ratio and thermal comfortable range.)
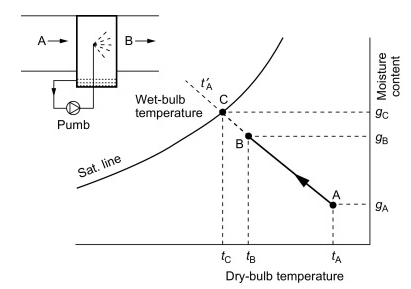
2.6 Psychrometric Chart (Temperature vs. Relative Humidity)
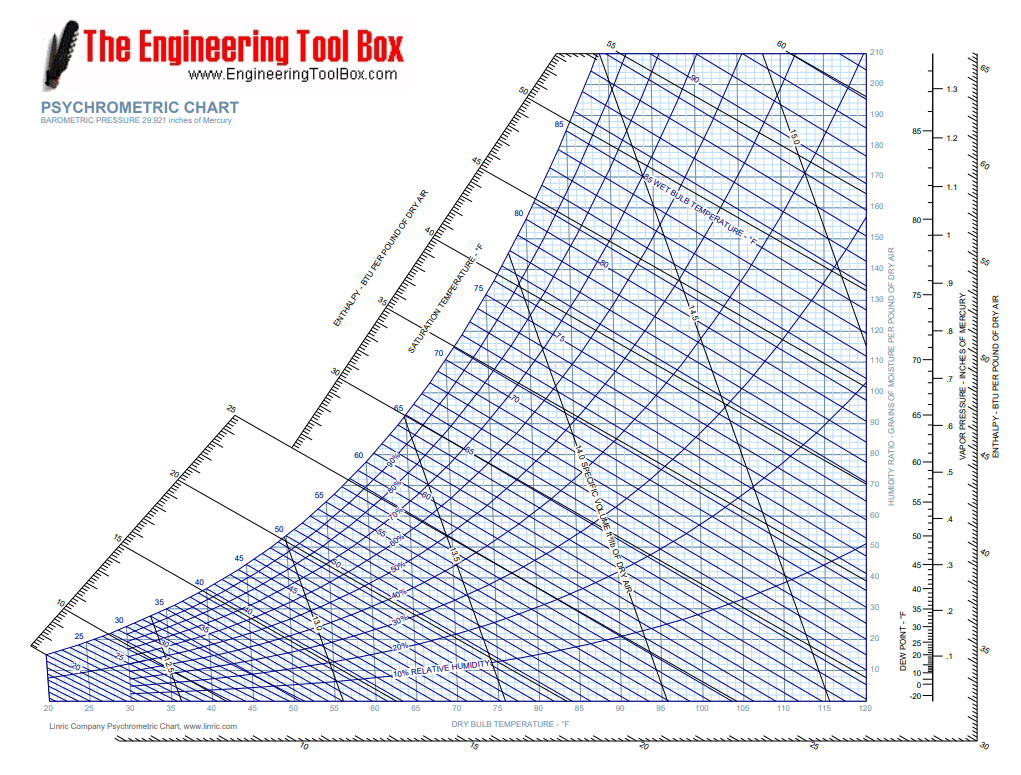
As you can see, this chart comes from Thompson, and it is used in recent engineering program to estimate facts. The X-axis means dry bulb temperature, Y-axis means humidity ratio, and relative humidity in parabola.
In next part, the thermal comfort tool, which is based on this chart, is used to generate exact figure for our project.
2.7 Center for the Built Environment Thermal Comfort Tool
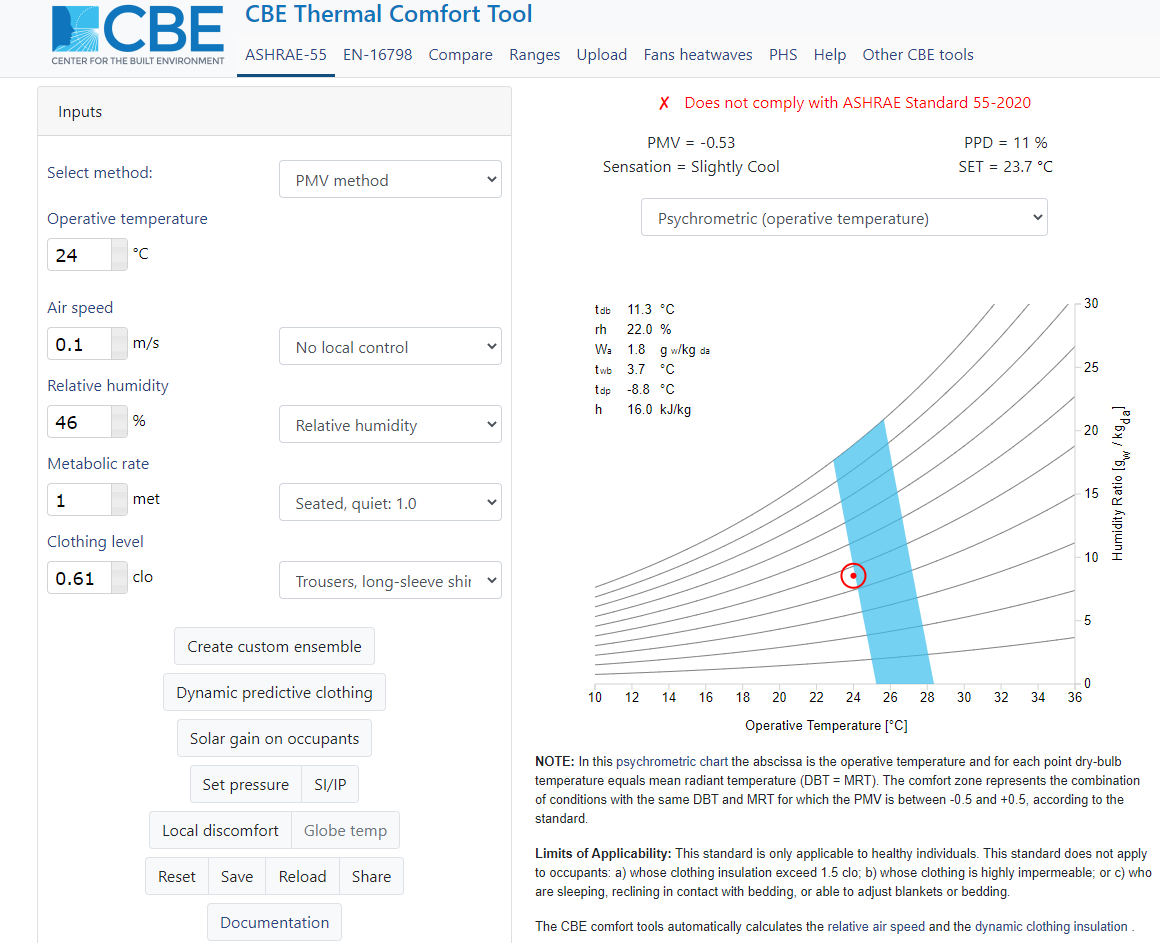
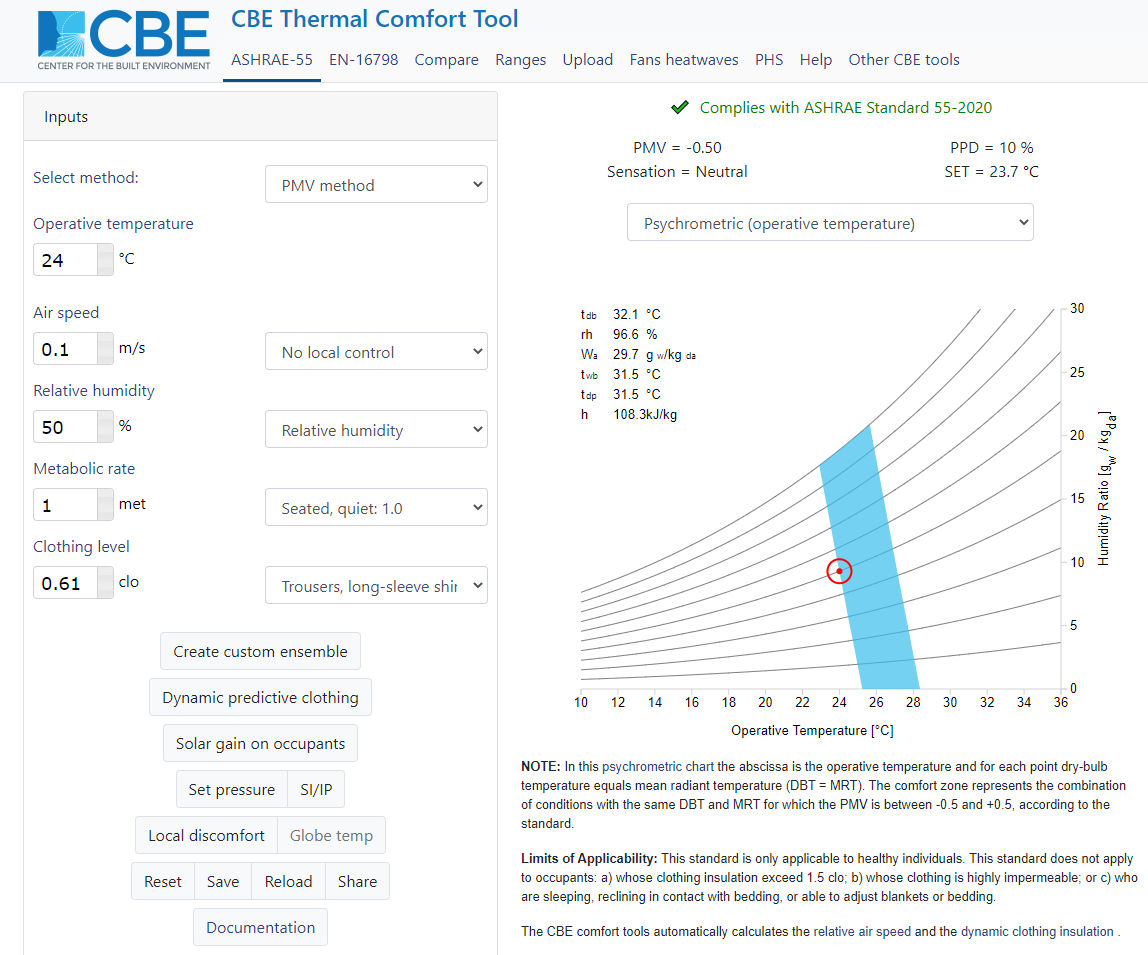
The website tool contains inputs and outputs. In our projects, the main two parts are temperature and relative humidity. The other inputs are set as assumptions, including Airspeed, metabolic rate, and clothing level, which are related to ASHRAE Standard 55-2020 to get the range. We use the formula to check the humidity ratio that comes from relative humidity (which is close to the chart in the tool).[1]
We use this tool by getting sensor value for the temperature at 24C and the relative humidity at 46%. These values are out of the thermal comfort range. Figure 2. shows the humidifier should work until the relative humidity reaches 50%, which means it’s in the thermal comfort range.
In this case, our humidifier should be on working. However, due to our humidifier’s shortcomings in both the sensor’s accuracy and the sensor’s inability to incorporate temperature, our humidifier didn’t release the vapor.
2.8 Humidifier
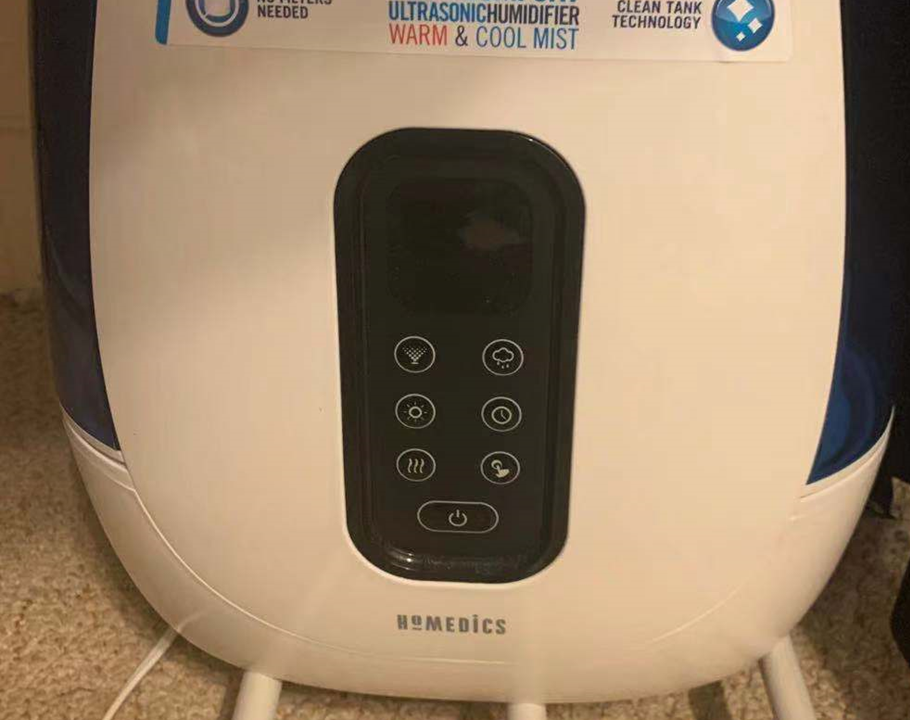

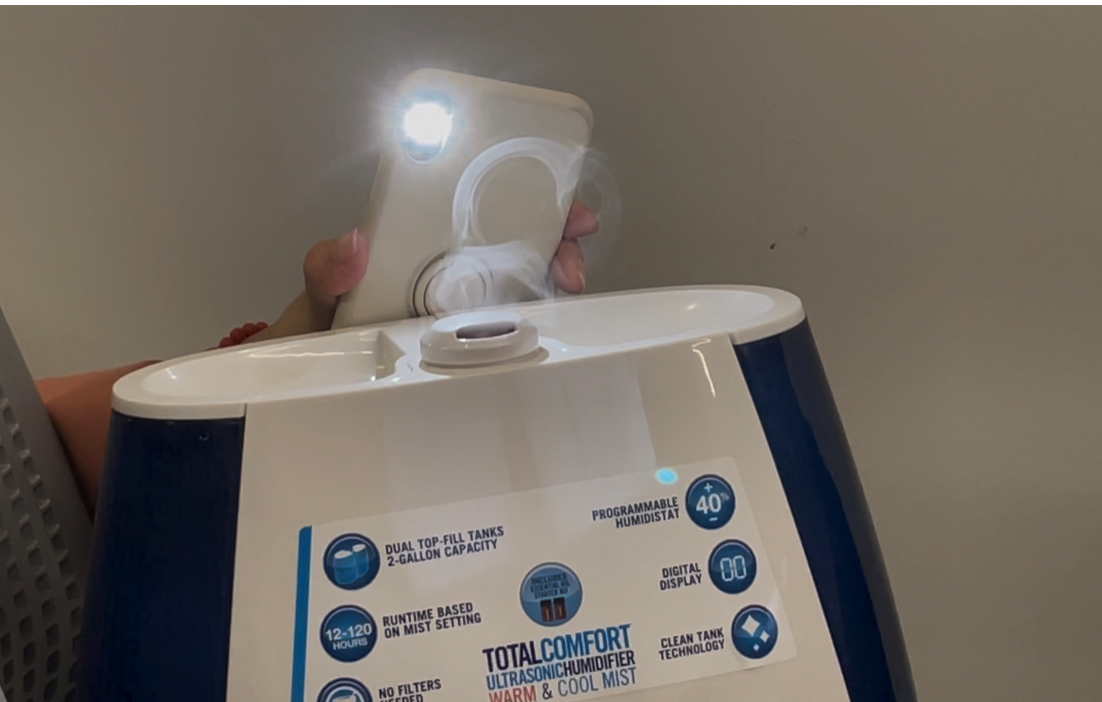
summary of humidifier The humidifier limits are based on:
Inability to Incorporate Temperature
The humidifier’s sensor can only get the humidity value without incorporating temperature. It can not get the correct thermal comfort range to release vapor efficiently. Since humidifier doesn’t have codes about comfort zone, its sensor can’t sense and analyse the proper information well.
2.9 Coding Progress
Code and Adafruit
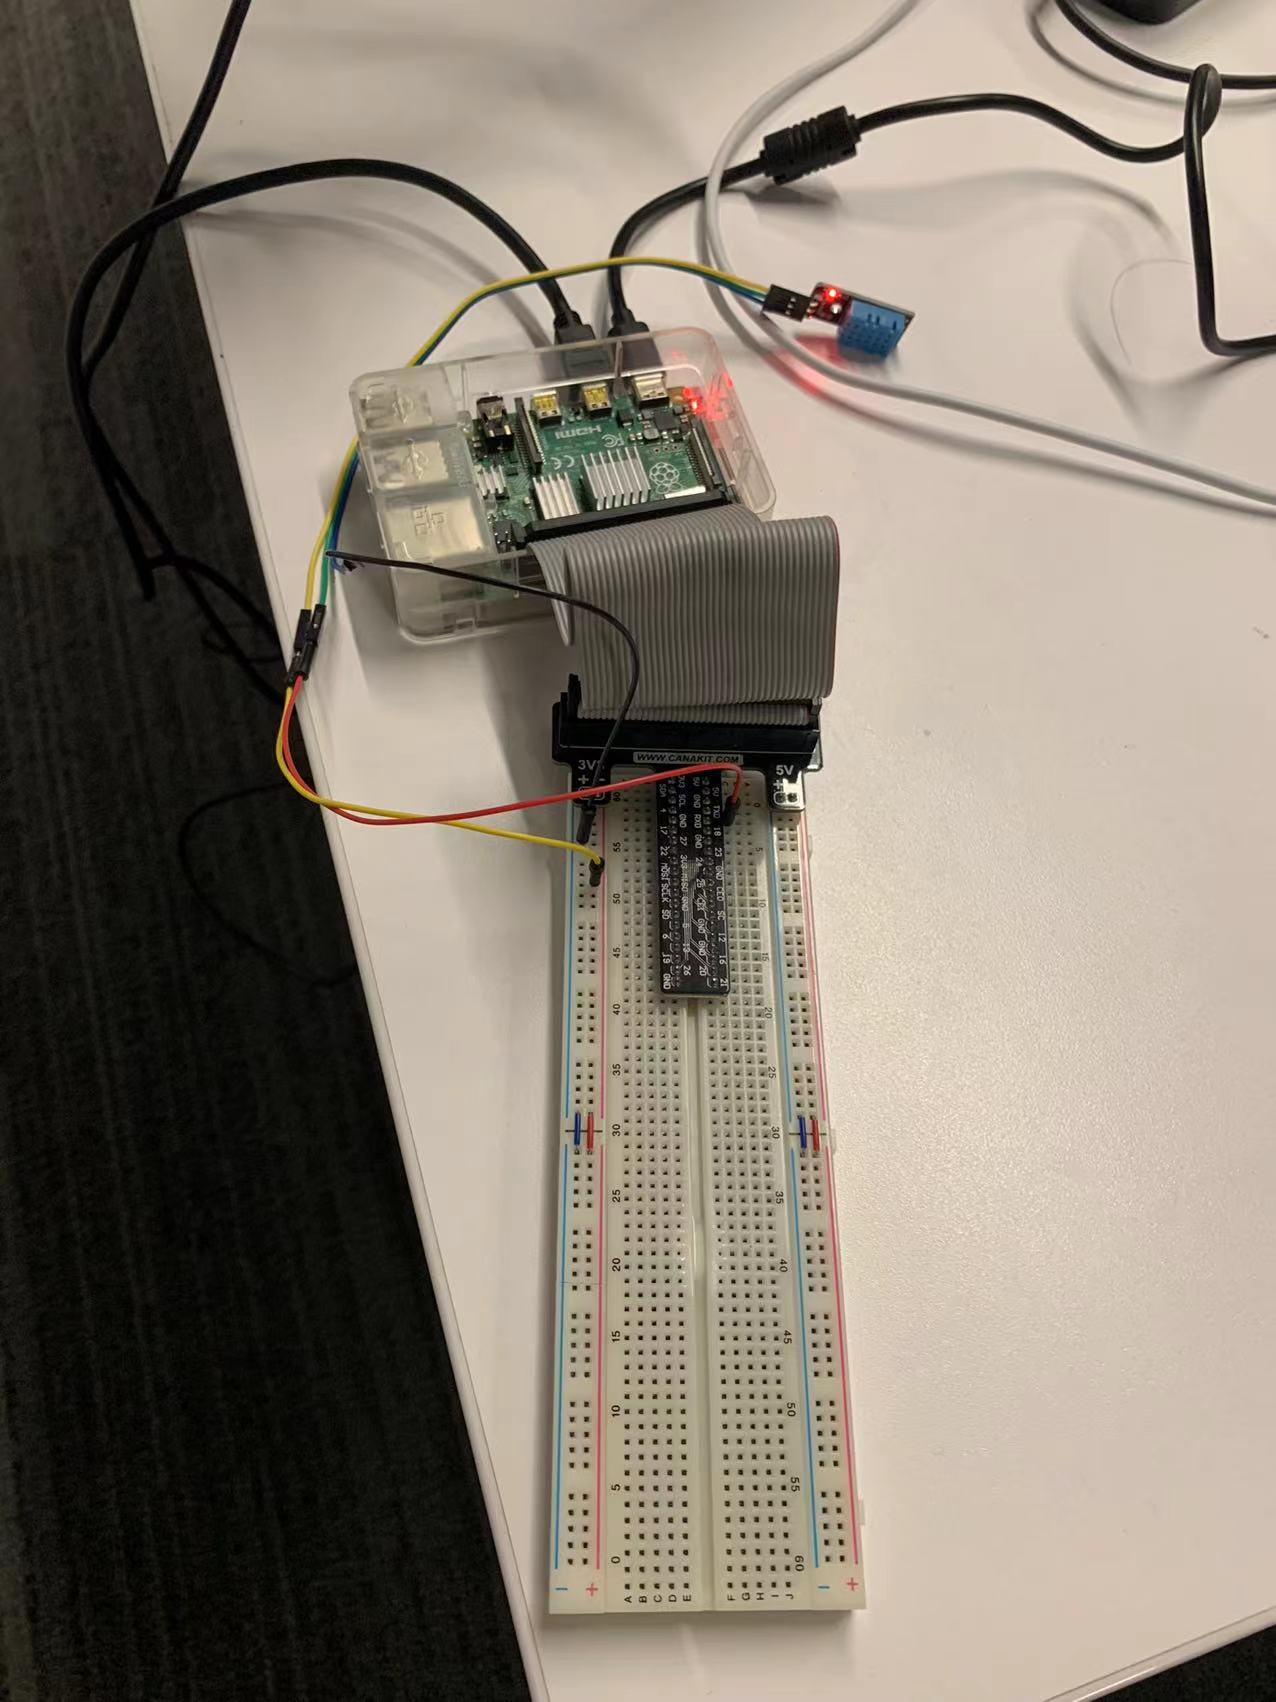
Our python script was inspired by the in class adafruit tutorial and the dht11 tutorial from homework 2. FIrst, we imported several modules including sys, RPi.GPIO, time, MQTTClient from Adafruit_IO, and dht11 from our dht.py script.
We started out by setting up the code to locate the various elements on the breadboard in the BCM format and created an instance of the dht-11 sensor. Next, we created a new feed to listen for the humidity data and set the Adafruit username and key. After initializing our client instance with the username and key, we connected the client to the Adafruit servers. We were then able to publish the humidity values collected from our dht11 instance and also print out the current humidity values. These values are then sampled every 5 seconds. We then repeated the process for temperature.
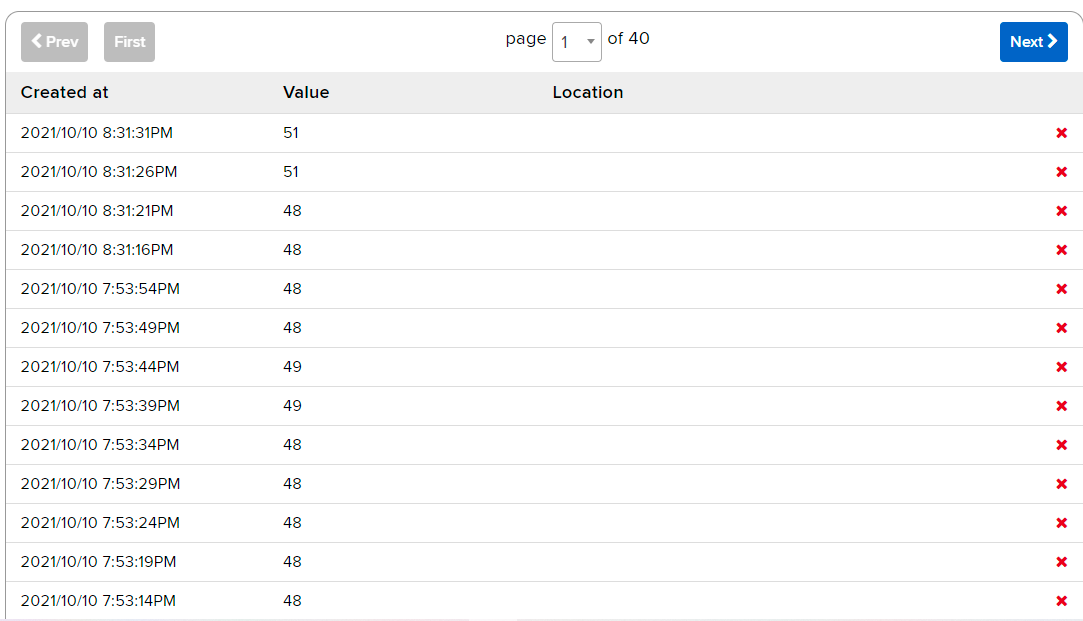
Our data from the humidity output contained a lot of zero values. In order to bypass this, the script was set to publish the last non-zero value to the server. This results in a cleaner looking graph with less sporadic changes.
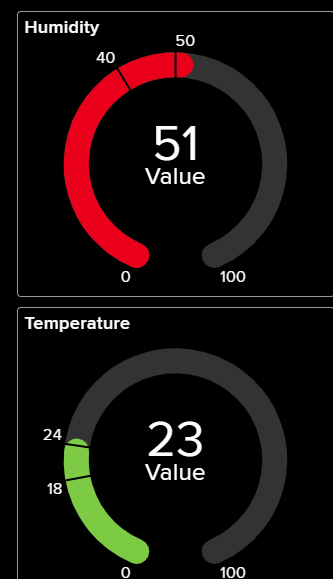
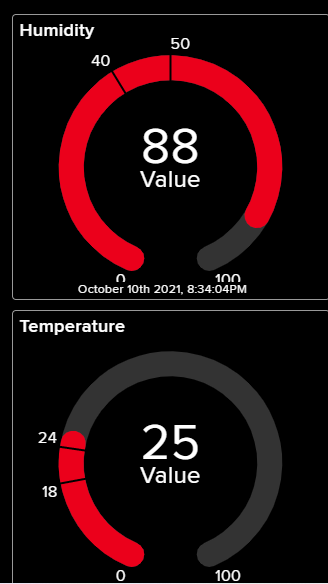
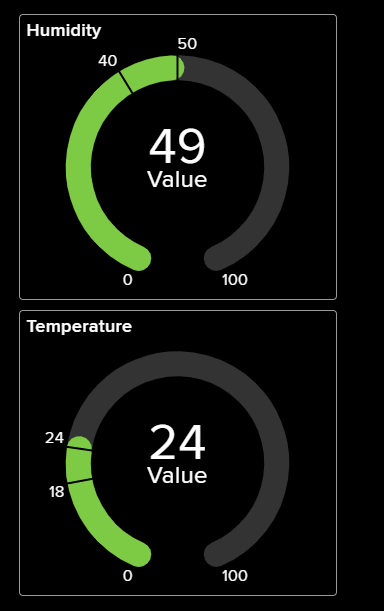
Our feed along with a real-time chart is displayed on the Adafruit website’s feed page. Here, there is a graph plotting the real-time values along with a list of historical data values. There is a seperate feed for both humidity and temperature which is used to display two different gauges in our dht11 dashboard. We set a standard humidity and temperature range for our gauge because it does not take conditional ranges.
Our code is listed below:
    # Import standard python modules.
    import sys
    import RPi.GPIO as GPIO
    import time

    # Import Adafruit IO MQTT client.
    from Adafruit_IO import MQTTClient

    import dht11

    Temp_sensor=14
    GPIO.setwarnings(False)
    GPIO.setmode(GPIO.BCM)       # Use BCM GPIO numbers
    # Initialise display
    #  lcd_init()
    instance = dht11.DHT11(pin = Temp_sensor)

    ADAFRUIT_IO_USERNAME = "Onethighandthreeleghairs"
    ADAFRUIT_IO_KEY = "aio_EnPO18As4BB1wkgScw4XScFmUWAS"


    # Set to the ID of the feed to subscribe to for updates.
    FEED_ID = 'DHT11'


    # Define callback functions which will be called when certain events happen.
    def connected(client):
        # Connected function will be called when the client is connected to Adafruit IO.
        # This is a good place to subscribe to feed changes.  The client parameter
        # passed to this function is the Adafruit IO MQTT client so you can make
        # calls against it easily.
        print('Connected to Adafruit IO!  Listening for {0} changes...'.format(FEED_ID))
        # Subscribe to changes on a feed named DemoFeed.
        client.subscribe(FEED_ID)

    def subscribe(client, userdata, mid, granted_qos):
        # This method is called when the client subscribes to a new feed.
        print('Subscribed to {0} with QoS {1}'.format(FEED_ID, granted_qos[0]))

    def disconnected(client):
        # Disconnected function will be called when the client disconnects.
        print('Disconnected from Adafruit IO!')
        sys.exit(1)

    def message(client, feed_id, payload):
        # Message function will be called when a subscribed feed has a new value.
        # The feed_id parameter identifies the feed, and the payload parameter has
        # the new value.
        print('Feed {0} received new value: {1}'.format(feed_id, payload))


    # Create an MQTT client instance.
    client = MQTTClient(ADAFRUIT_IO_USERNAME, ADAFRUIT_IO_KEY)

    # Setup the callback functions defined above.
    client.on_connect    = connected
    client.on_disconnect = disconnected
    client.on_message    = message
    client.on_subscribe  = subscribe

    # Connect to the Adafruit IO server.
    client.connect()
    saved_data_h = 0
    saved_data_t = 0
    def main():
      while True:
        try:
          client.loop()
        except:
          print("Failed to get data, retrying\n", e)
          client.reconnect()
          continue


        result = instance.read()
        if result.humidity == 0:
            client.publish('humidity', saved_data_h)
        else:
            client.publish('humidity', result.humidity)
            saved_data_h = result.humidity

        if result.temperature == 0:
            client.publish('temperature', saved_data_t)
        else:
            client.publish('temperature', result.temperature)
            saved_data_t = result.temperature

        print('humidity: ',result.humidity)
        print('temperature: ',result.temperature)
        time.sleep(5)


    if __name__ == '__main__':
        try:
            main()
        except KeyboardInterrupt:
            GPIO.cleanup()
            client.disconnect()
            sys.exit(0)


We also tested dht11 and our system in different conditions. The follows figures show the link between adafruit and sensor works well!
3. Discussion
In this project, we presented a practical problem aimed to provide more accurate control of our humidifier. We chose sensors, validated methods, and tested procedures to achieve our goals. We aimed to produce a system that allowed our humidifier to adjust the humidity to the most comfortable range of the human body while taking the temperature into account. After understanding the phenomena we were interested in, we chose a related sensor (DHT11) to achieve our goals, designed the circuit on the Raspberry Pi, and wrote the code that links the sensor to the Adafruit website through the Raspberry Pi.
We also developed a methodology to determine the ideal humidity using temperature. First, we collected the temperature and humidity data from the DHT11 sensor. Then we use the CBE Thermal Comfort Tool to check whether the temperature and humidity are within the ideal comfort range. Finally, we switch on or off the humidifier externally. Throughout this process, we gained a deeper understanding of humidity, better understood the relation between temperature and humidity that the human body feels, and learned about other factors that influence it. We also became more familiar with the whole process of using the sensor, the Raspberry Pi, and the Adafruit web server.
Our system still has certain shortcomings that stem from the limitations of the sensor and our coding ability. First, we had trouble implementing the various parameters and formulas in the CBE Thermal Comfort Tool directly into the Raspberry Pi code. This code would have helped us determine, in real-time, the comfortable temperature and humidity range of the human body and send a reminder to our mobile phone. Secondly, we only used DHT 11 to detect temperature and humidity. Additional sensors could be used to sense even more phenomena that could affect human comfort. In the future, we may be able to design a more inclusive system that directly computes whether the humidity appears in the most suitable range for the human body. If it is outside of this computed range, the Raspberry Pi would directly send a reminder to the mobile phone to turn on or turn off the humidifier.
This group project has allowed us to solved many different problems, which have enhanced our understanding of humidity, sensors, Raspberry Pi codes, and Adafruit.
4. Acknowledgement
We acknowledge and thank Professor Mario Berges and our teaching assistant Pengkun Liu for their help and patience in guiding us through this project and this class.
Reference
[1] CBE Thermal Comfort Tool. (n.d.). CBE Thermal Comfort Tool. Retrieved October 12, 2021, from https://comfort.cbe.berkeley.edu/
[2] Wikipedia contributors. (2021, September 16). Humidity. Wikipedia. https://en.wikipedia.org/wiki/Humidity#Specific_humidity
[3] Vapor Pressure of Water from 0 °C to 100 °C. (n.d.). Vapor Pressure of Water. Retrieved October 12, 2021, from https://www.wiredchemist.com/chemistry/data/vapor-pressure
[4] Wikipedia contributors. (2021a, September 14). Thermal comfort. Wikipedia. https://en.wikipedia.org/wiki/Thermal_comfort#Thermal_comfort_models
[5] Guenther, S. (2021, June 14). What Is PMV? What Is PPD? The Basics of Thermal Comfort. SimScale. https://www.simscale.com/blog/2019/09/what-is-pmv-ppd/
[6] Standard 55 Thermal Environmental Conditions for Human Occupancy. (n.d.). Web Starter Kit. Retrieved October 12, 2021, from https://www.ashrae.org/technical-resources/bookstore/standard-55-thermal-environmental-conditions-for-human-occupancy
[7] Temperature and Humidity. (n.d.). Temperature and Humidity. Retrieved October 12, 2021, from https://www.oshatrain.org/courses/pages/711temp.html
[8] Ali, Z. (2021, August 16). Introduction to DHT11. The Engineering Projects. https://www.theengineeringprojects.com/2019/03/introduction-to-dht11.html
[9] Humidifier - an overview - ScienceDirect Topics. (n.d.). Humidifier. Retrieved October 12, 2021, from https://www.sciencedirect.com/topics/engineering/humidifier
[10] Air - Psychrometric Chart for Standard Atmospheric Conditions - Imperial Units. (n.d.). Air - Psychrometric Chart. Retrieved October 12, 2021, from https://www.engineeringtoolbox.com/psychrometric-chart-d_816.html
[11] DHT11 basic temperature-humidity sensor + extras. (n.d.). Adafruit. Retrieved October 12, 2021, from https://www.adafruit.com/product/386